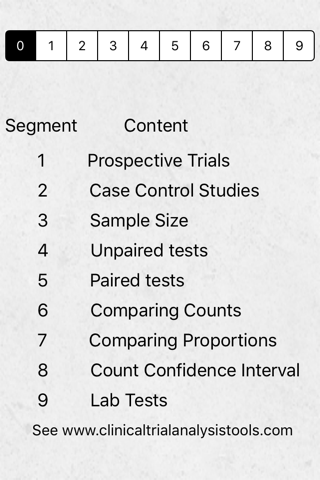
This app performs the following analysis useful for both clinical trials and epidemiological studies:
Prospective Study
This app calculates the relative risk for contingency table data including a 95% confidence interval.
Retrospective Study
The app calculates an odds ratio with 95% confidence interval for both a case control study and a matched case control study.
Sample Size
This app calculates the sample size required for a clinical trial for various levels of alpha and power. It requires the minimum clinically important difference to detect and the standard deviation of the trial data. Alternatively, the sample size can be calculated with two proportions to distinguish between.
The sample size is given for the following combinations of alpha and power:
Alpha Power
5% 80%
5% 90%
1% 80%
1% 90%
Unpaired t-test
Given the sample size, mean and standard deviation for the first group, and also for the second group, this app will calculate the t-stat, p-value, 95% confidence interval of the difference in means, as well as the power of the test to detect a
specified difference
MannWhitney test
This test answers the question: If the distribution of ranks between two groups were distributed randomly, what is the probability that the difference between the sum of ranks for each group would be so large. This method requires the size and ranksum for group1 and group2. It provides a p-value for the probability that the ranks between the two groups are distributed randomly.
Paired t-test
When subjects are matched, it is appropriate to use a paired t-test. This test requires the following inputs:
1 Number of Pairs
2 Pair Difference Mean
3 Standard Deviation of paired differences
It calculates a t-statistic, a p-value, and a 95% confidence interval for the pair difference means.
Wilcoxon test
The nonparametric Wilcoxon test determines if the intervention and control effects on paired samples are equal. It requires the following inputs:
1 Number of pairs
2 Sum of the positive ranks
3 Sum of the negative ranks
These ranks are calculated by calculating the differences between the paired data points. A decrease is a negative number and an increase is a positive number. Then rank the absolute value of the differences.
Now add up the ranks of all of the positive differences and the ranks of the negative differences.
This app uses the inputs to test the null hypothesis that the intervention and control effects are equal.
Comparing Observed and Expected Counts
This app uses a chi-square goodness of fit test to compare observed and expected counts for up to eight categories. It tests the Null hypothesis that the Observed and Expected frequencies are equal using alpha = 5%.
Comparing Two Proportions
This method uses a goodness of fit chi-square to test the null hypothesis that two groups are distributed equally in the overall population. This allows testing that the survival proportions of two groups are equal. The null hypothesis is that the Observed Proportions equals the Expected Proportions. It calculates a chi-square statistic and p-value. It also calculates the power to reject H0 when group one and group two have specified proportions of the population.
Confidence Interval of a Count
This method calculates the 95% confidence interval for a count using a poisson distribution.
Interpreting Lab Tests
This method calculates:
1 Sensitivity
2 Specificity
3 Positive Predictive Value
4 Negative Predictive value
For more details, and examples, please see the support URL www.ClinicalTrialAnalysisTools.com
